Build & analyze
Reading a wheel ideas page
A wheel ideas page answers one question for one ticker: at yesterday’s close, what did a cash-secured put and a covered call actually pay? Every number on it comes from one stored end-of-day snapshot, and the page tells you which one.
Where they live
The index at /options/wheel lists every ticker with a page, grouped by sector and sorted by options liquidity. Each ticker has its own page at /options/TICKER/wheel — for example SPY — and sectors with at least five published tickers get their own hub.
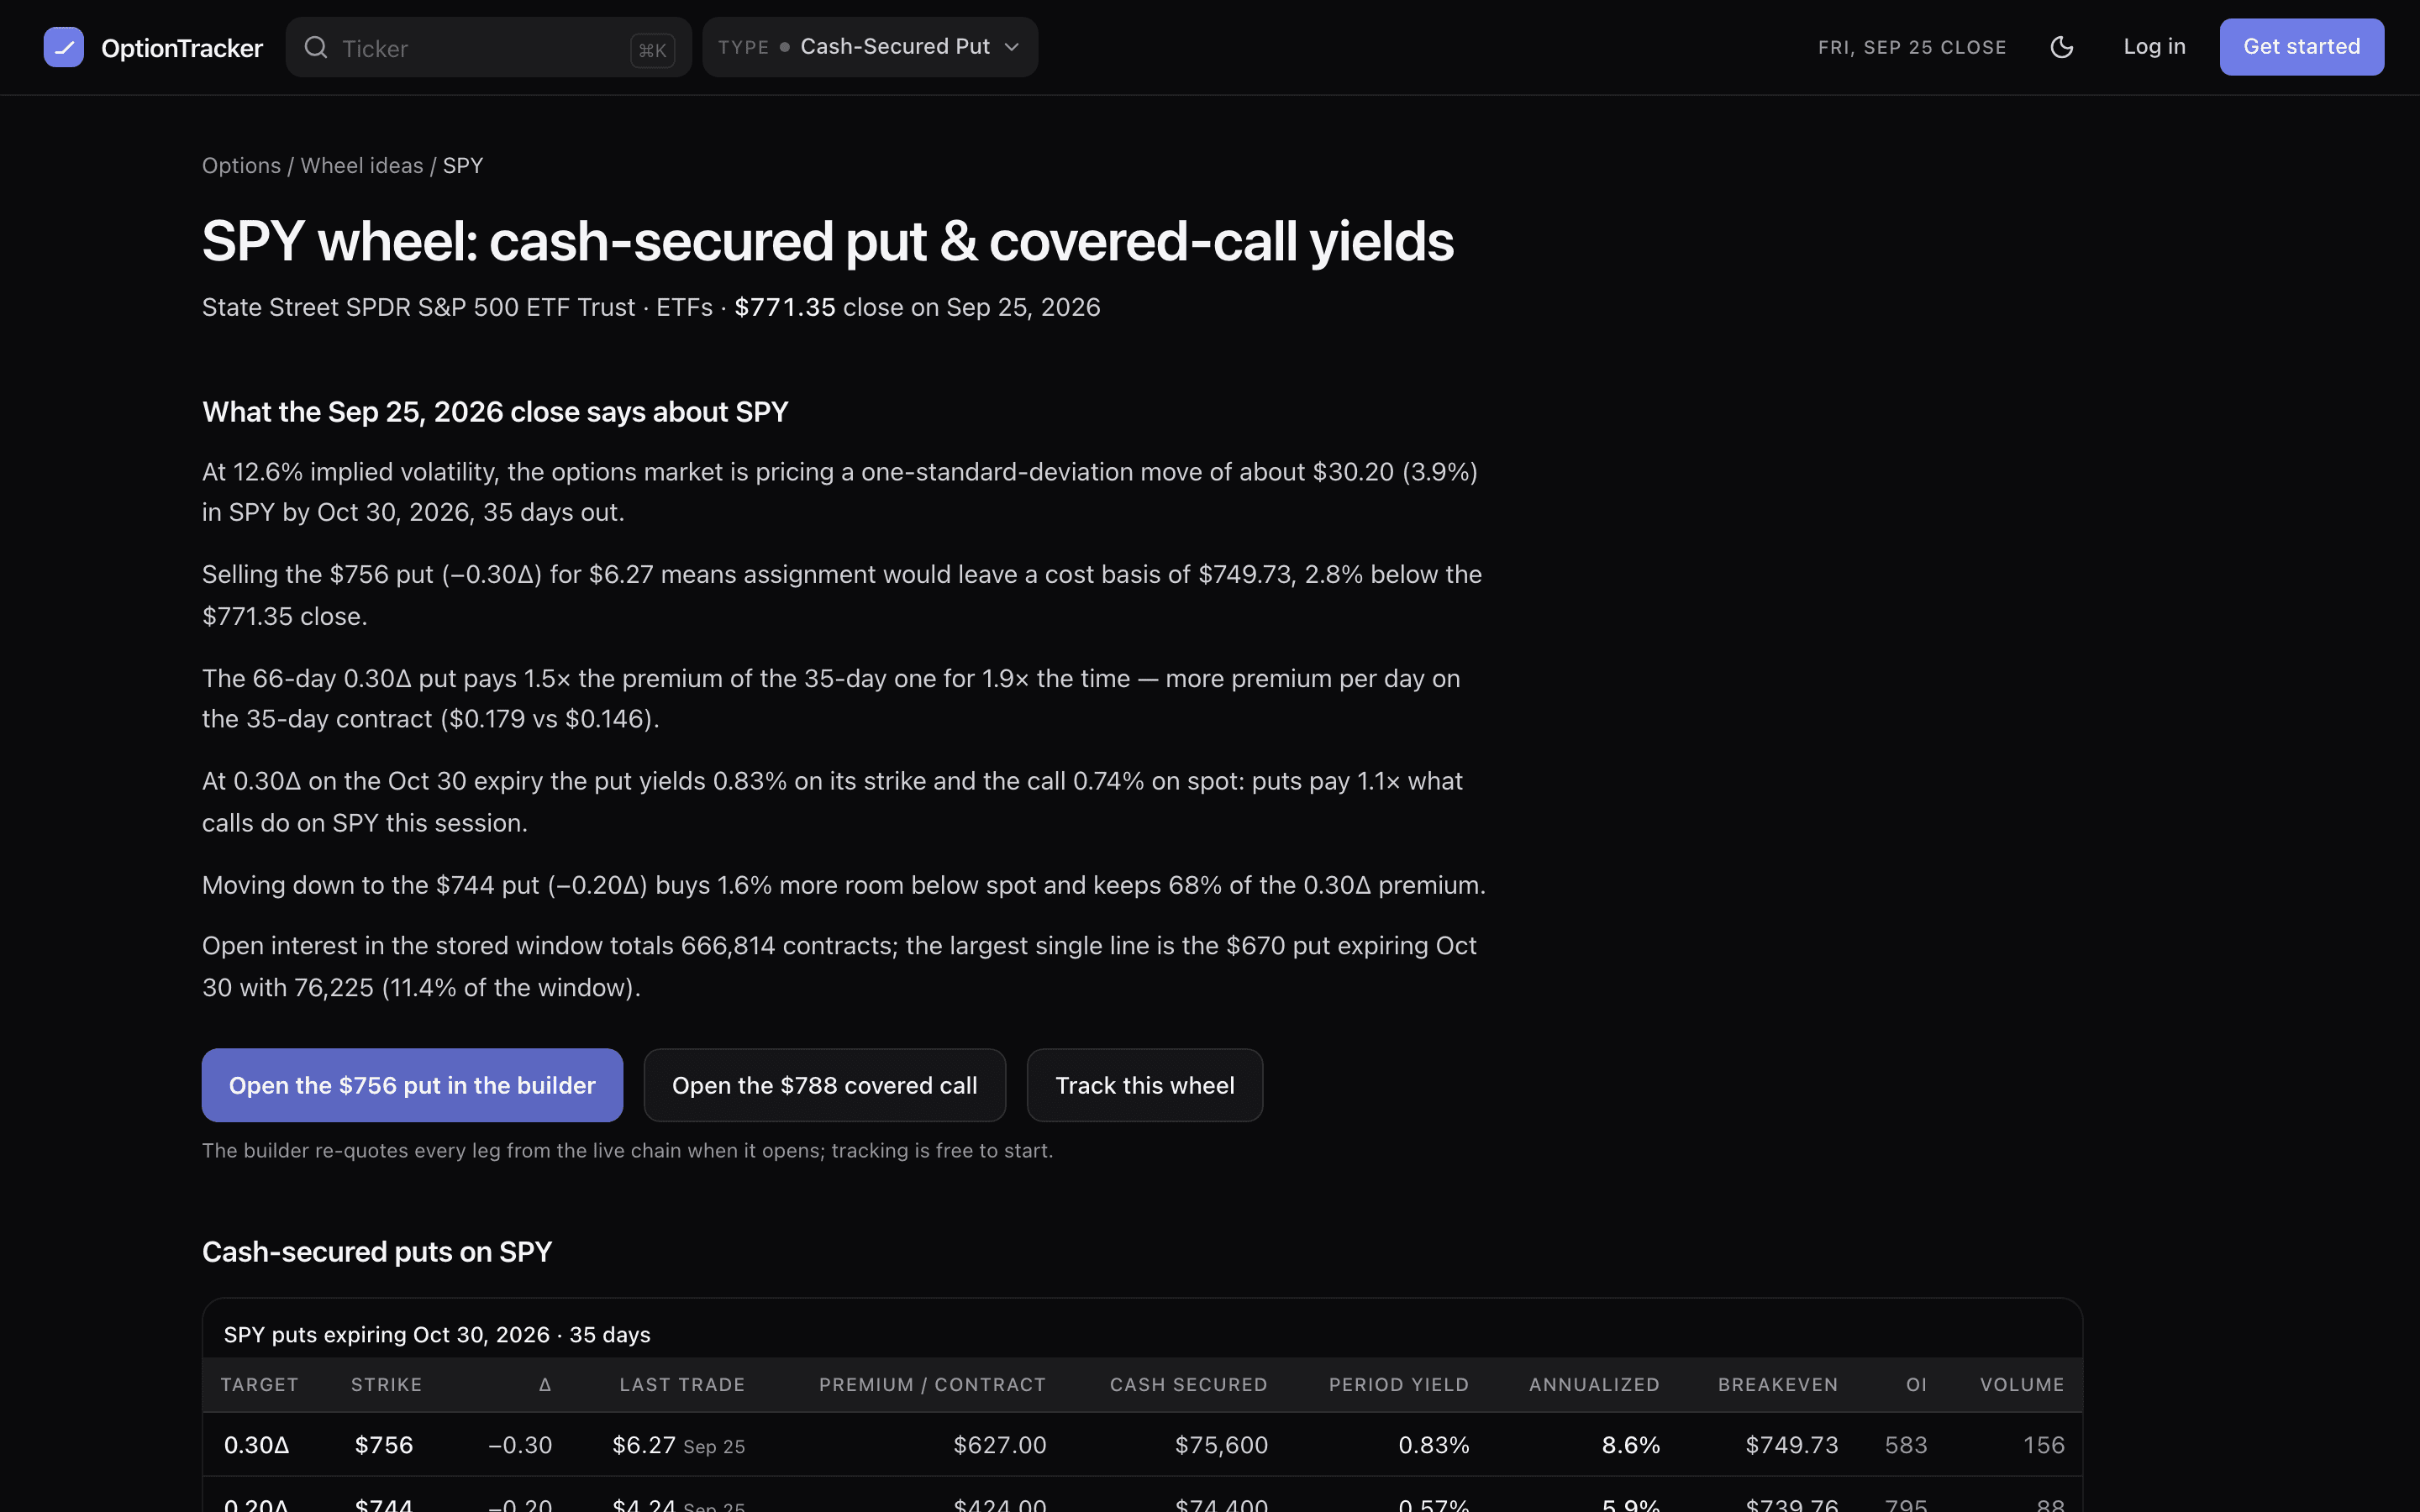
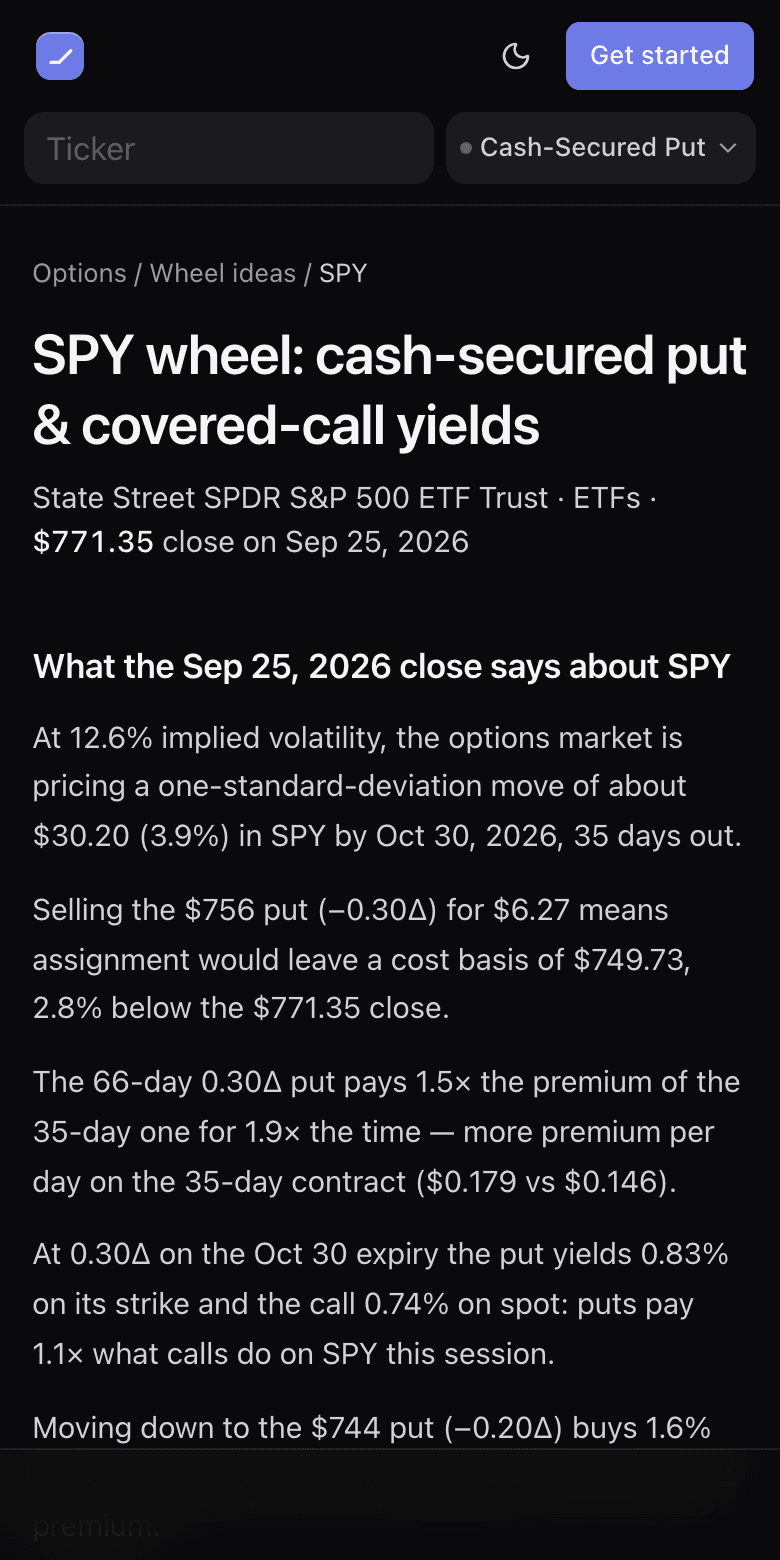
The yield tables
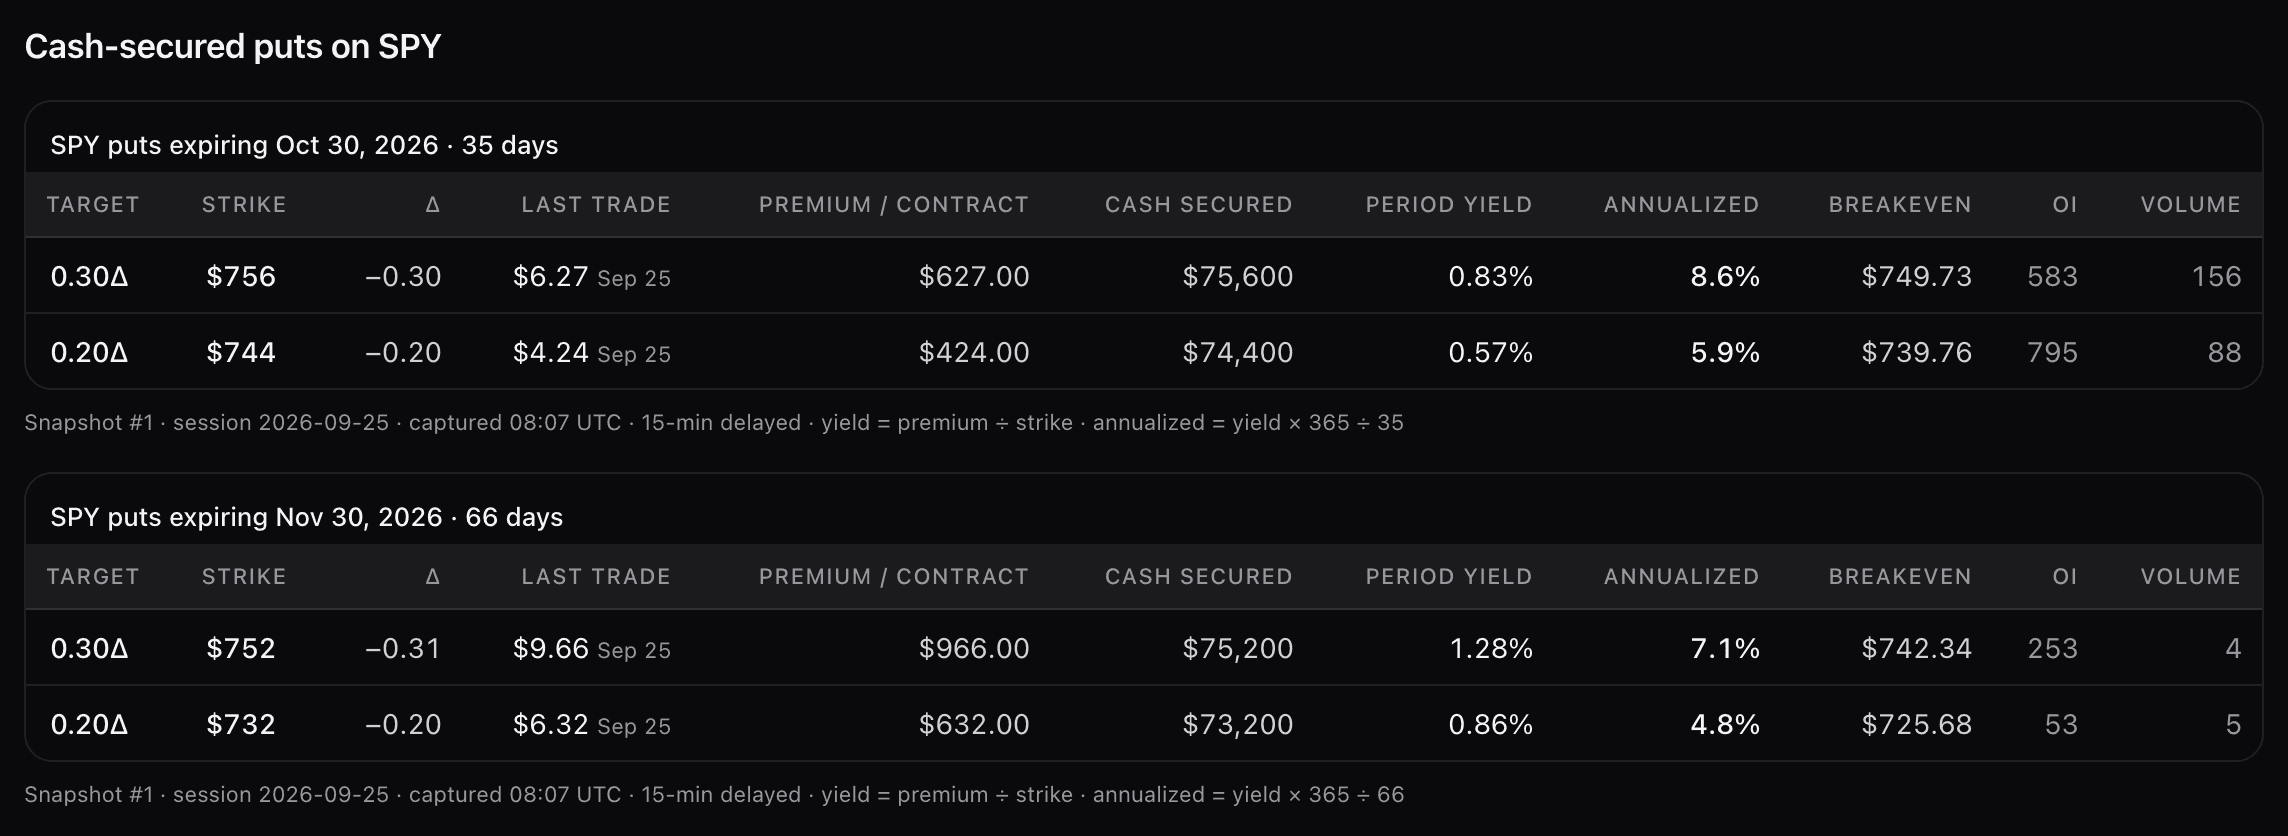
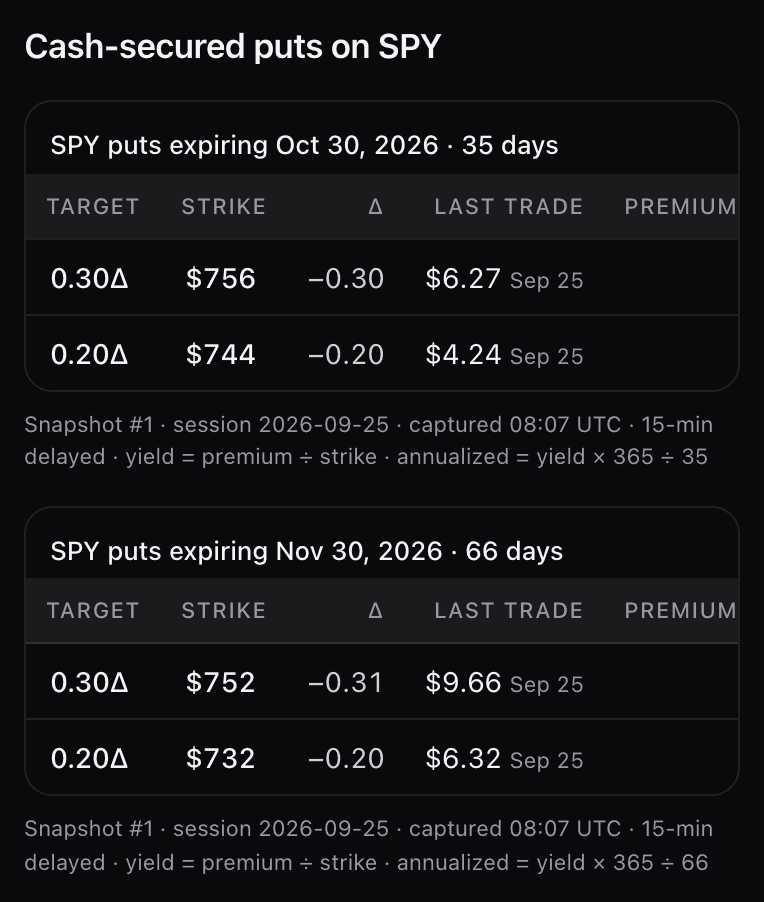
Four tables: cash-secured puts and covered calls, each at two expiries — the first at least 30 days out and the first at least 60. In each, one row for the contract nearest 0.30Δ and one nearest 0.20Δ (within ±0.05). The premium is that contract’s last trade, used only if it printed in that session, sits above intrinsic value and is in order with its neighbouring strikes; otherwise the row says why it is empty.
| Column | How it is worked out |
|---|---|
| Period yield (puts) | Premium ÷ strike — the return on the cash you set aside. |
| Yield on spot (calls) | Premium ÷ the close — the return on the shares you already hold. |
| If called | (Premium + strike − close) ÷ close — premium plus the capped gain if the shares are called away. |
| Annualized | Period yield × 365 ÷ days to expiry. Never shown under 30 days: ×365 on a week turns noise into a headline. |
| Breakeven (puts) | Strike − premium — your cost per share if assigned. |
| Δ, OI, volume | As the data feed reported them for that contract that session. |
Why some fields say Unavailable
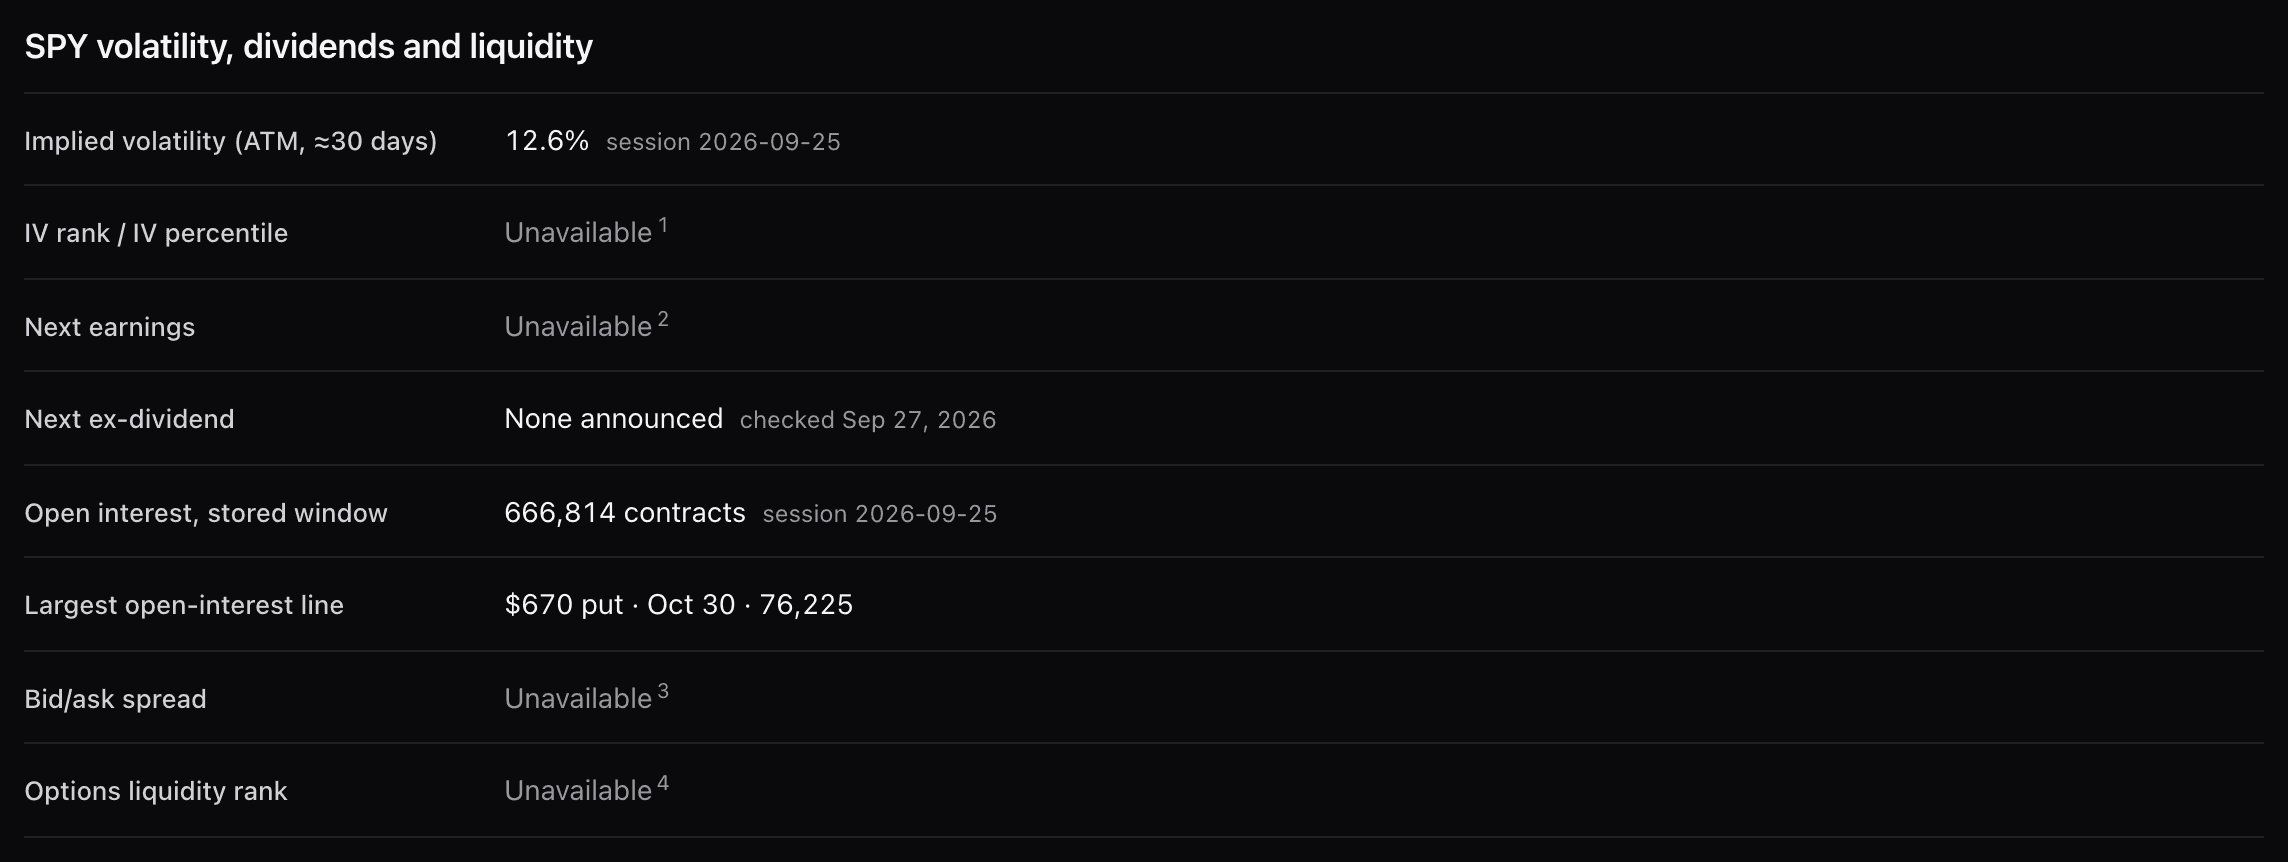
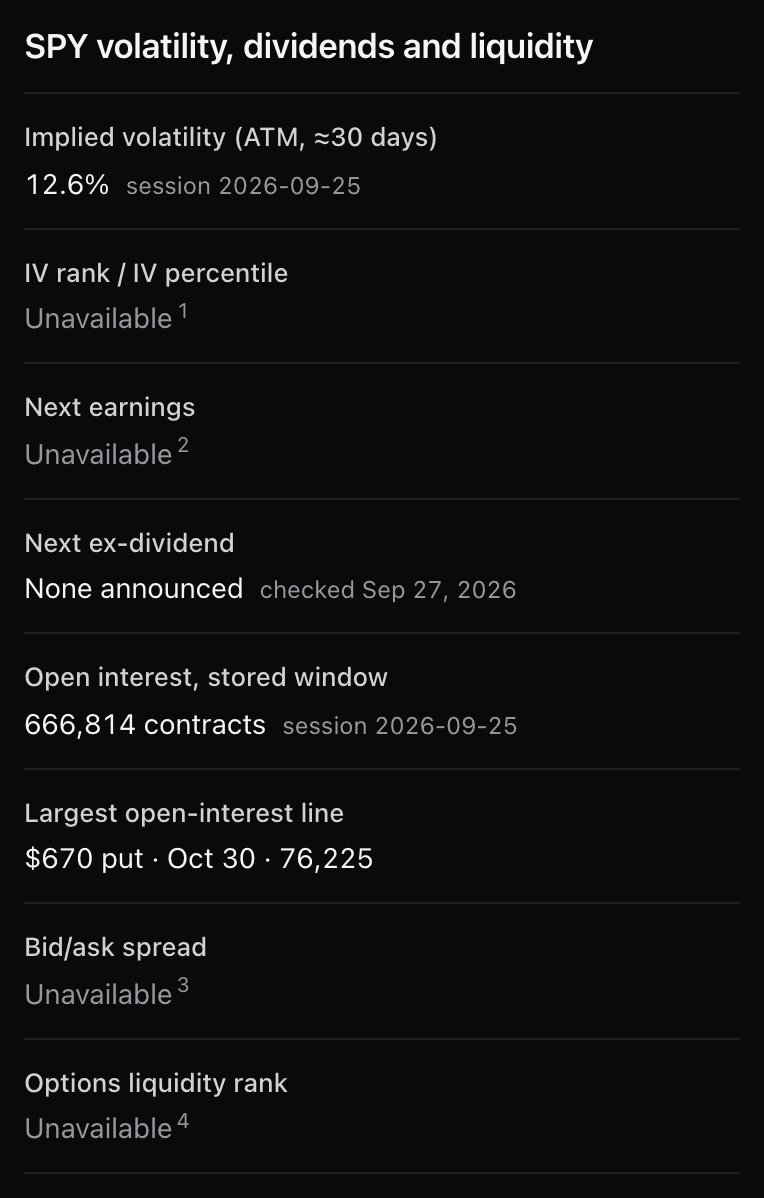
A figure appears only if it came from our licensed market data. When it did not, the page prints Unavailable with a numbered note saying why — never a zero, never an estimate. Three fields are always unavailable today:
- Bid/ask spread — our feed carries last trades, not live quotes, so there is no spread to show.
- Next earnings — our data provider does not license announced earnings dates, and we do not publish guesses.
- IV rank and IV percentile — both need a year of daily implied-volatility history, which we are building one session at a time. Until it exists the field says how far along it is.
The index and sector hubs
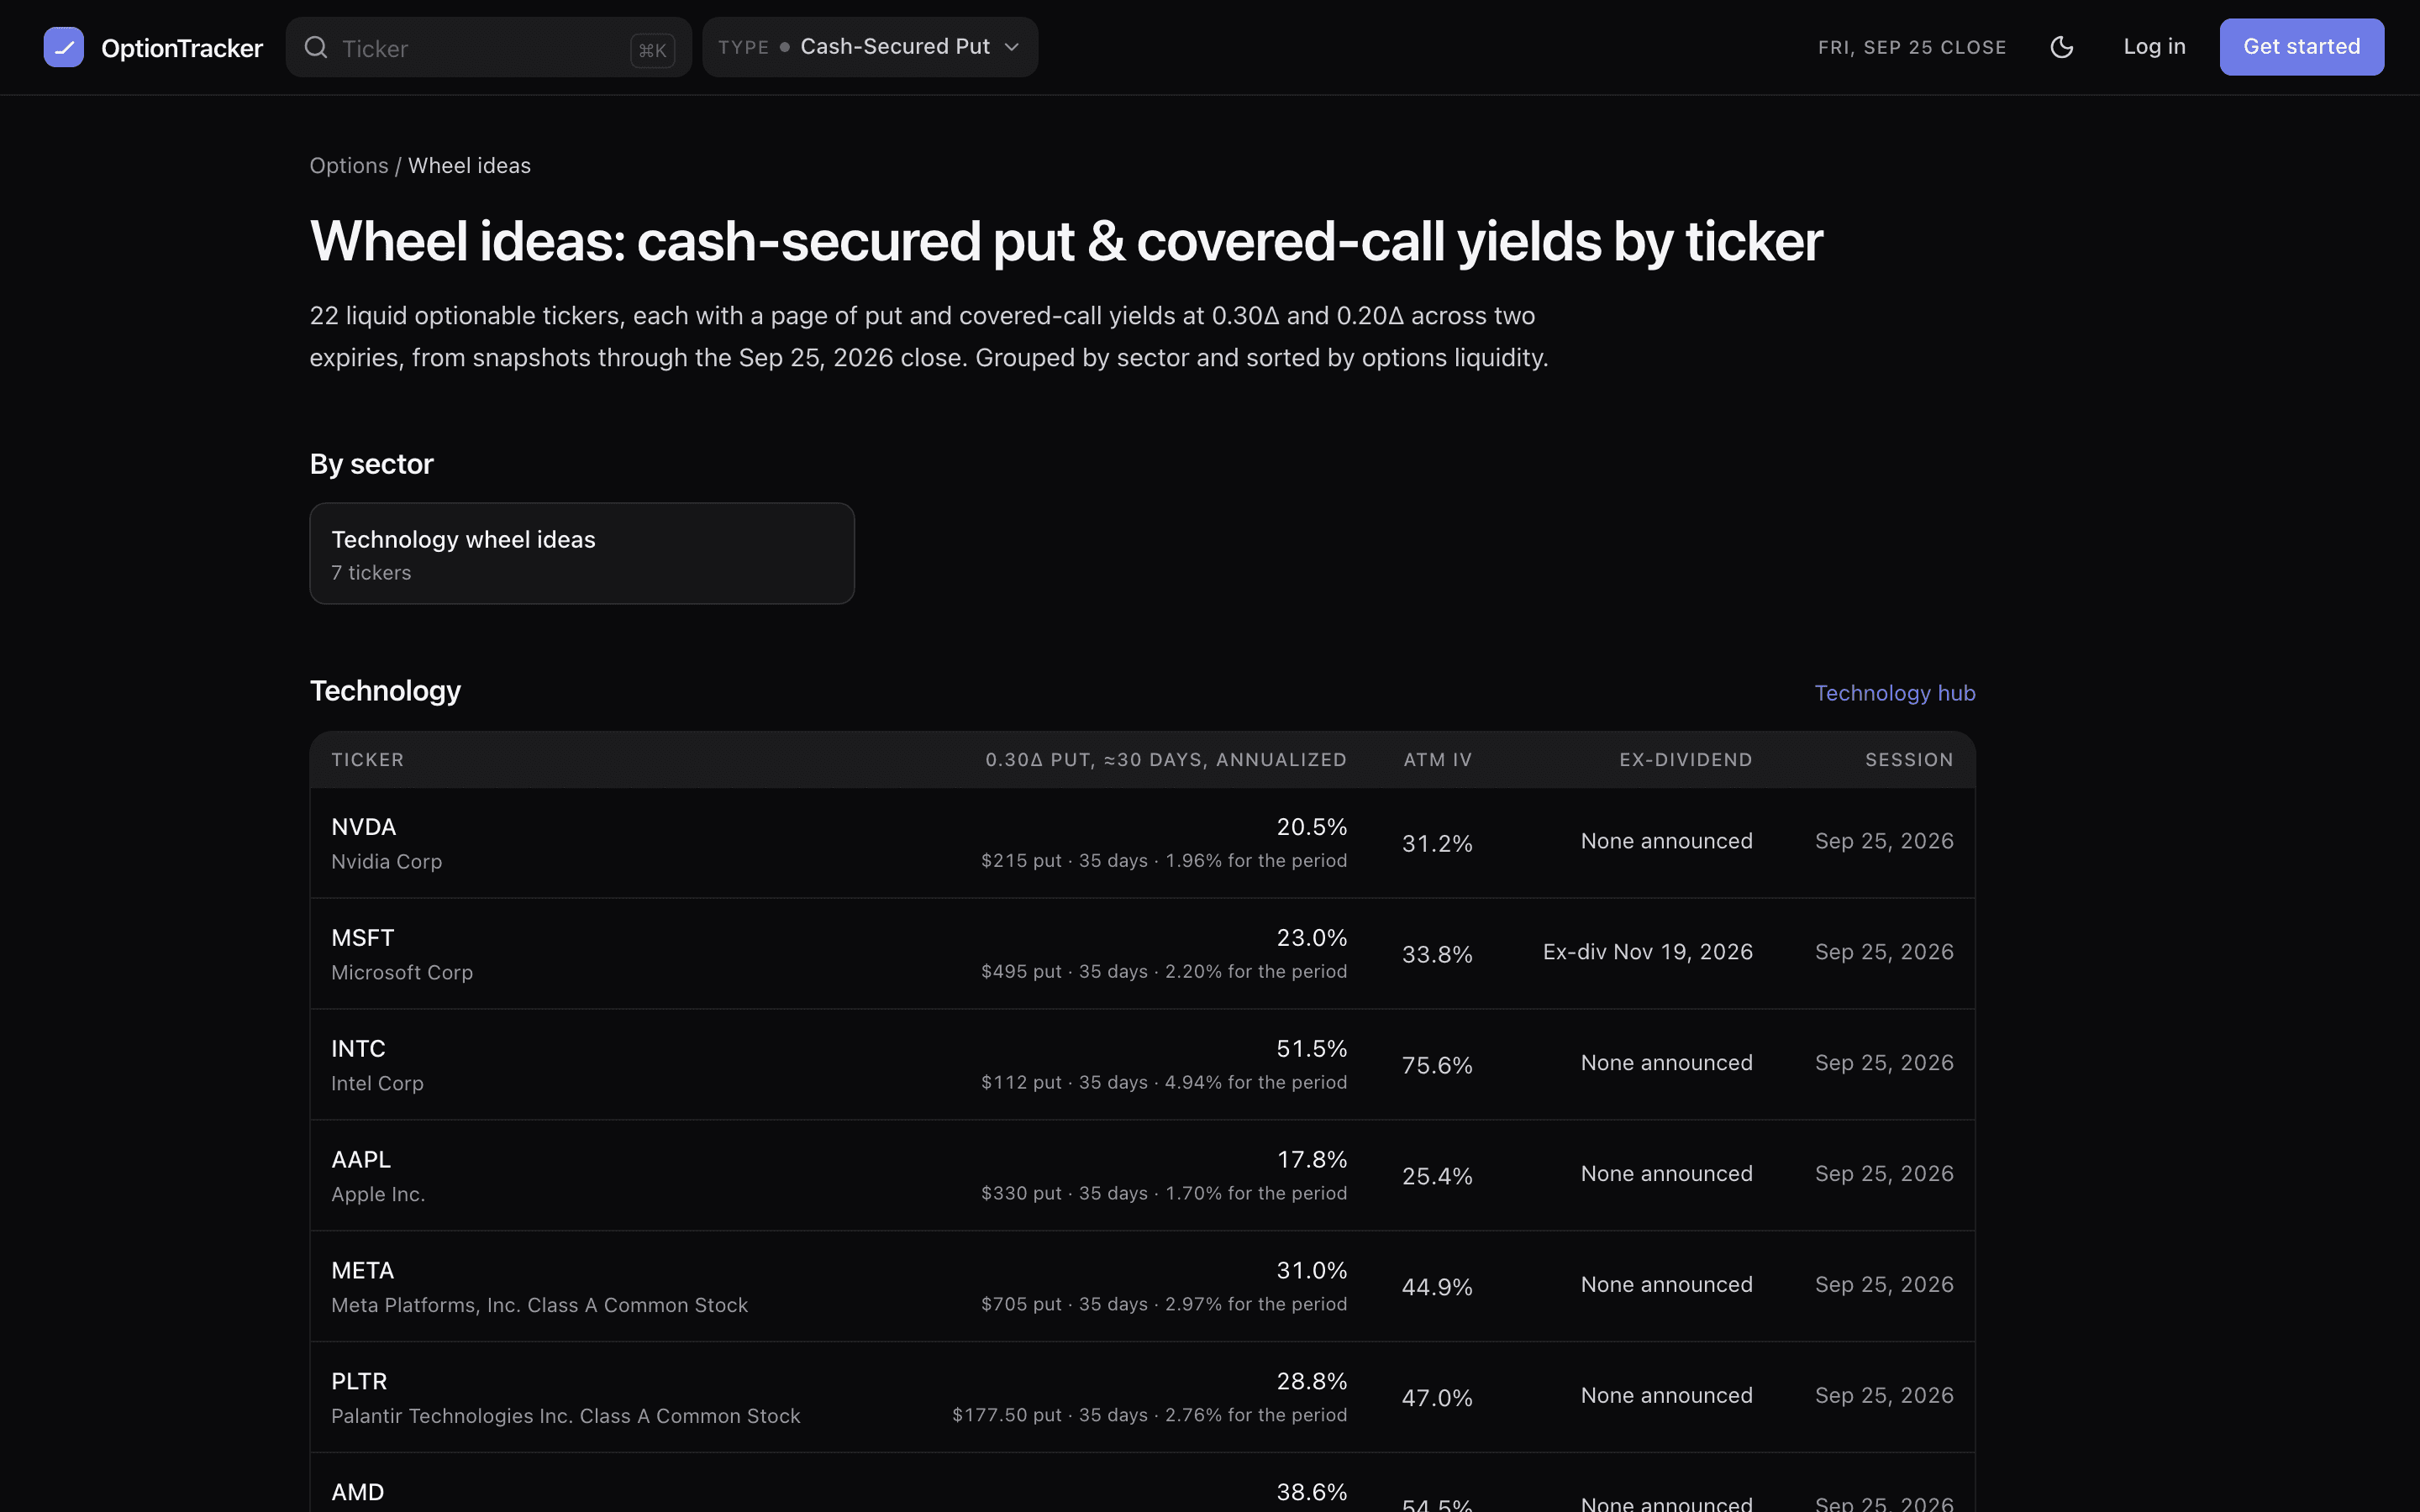
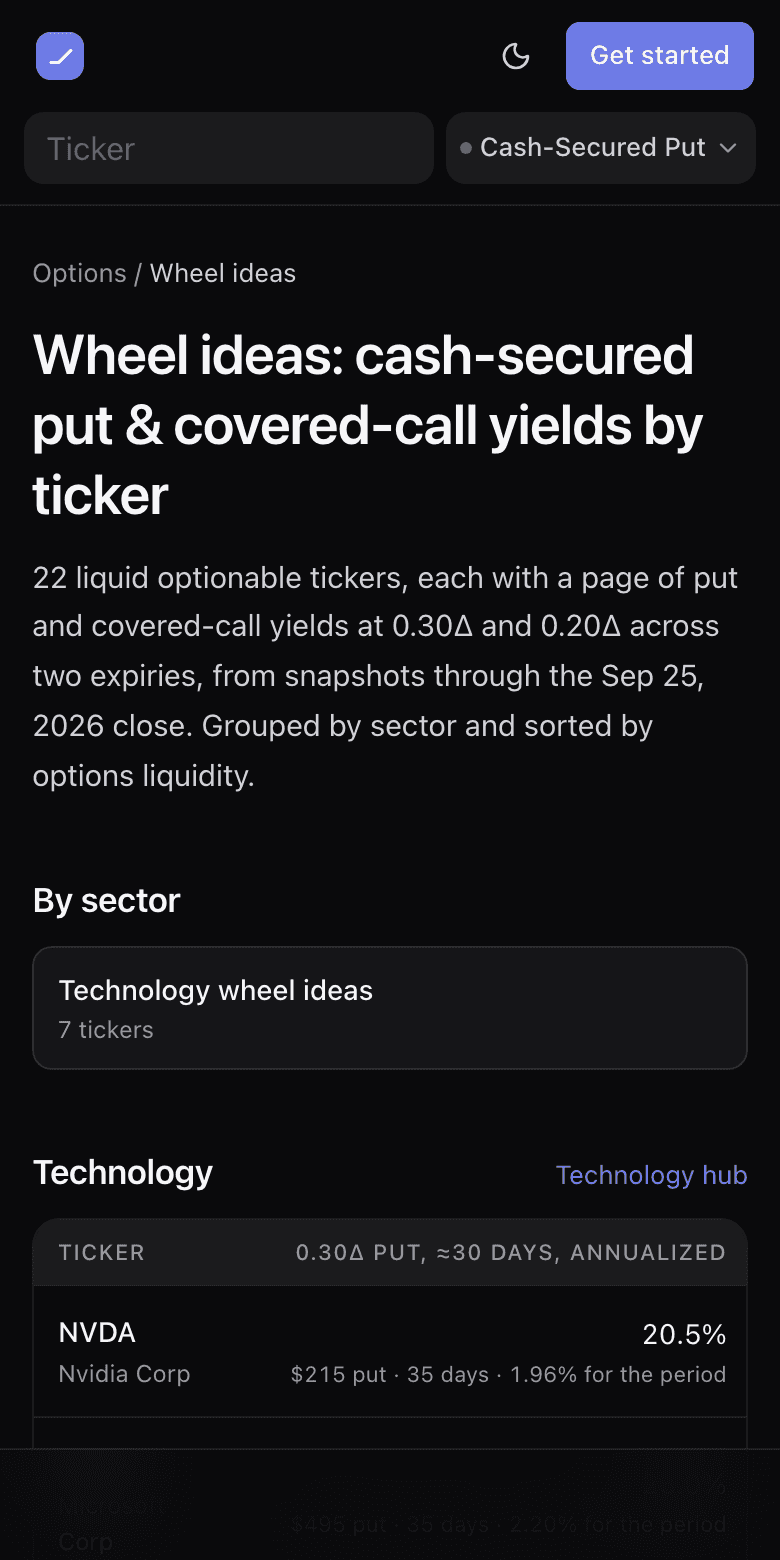
A ticker is listed only when its snapshot fills its page — at least three of four put cells and three of four call cells. Tracking the wheel you open from here works the same as any other: see wheel cycles.