Build & analyze
Pick the strike, let the expiries compete
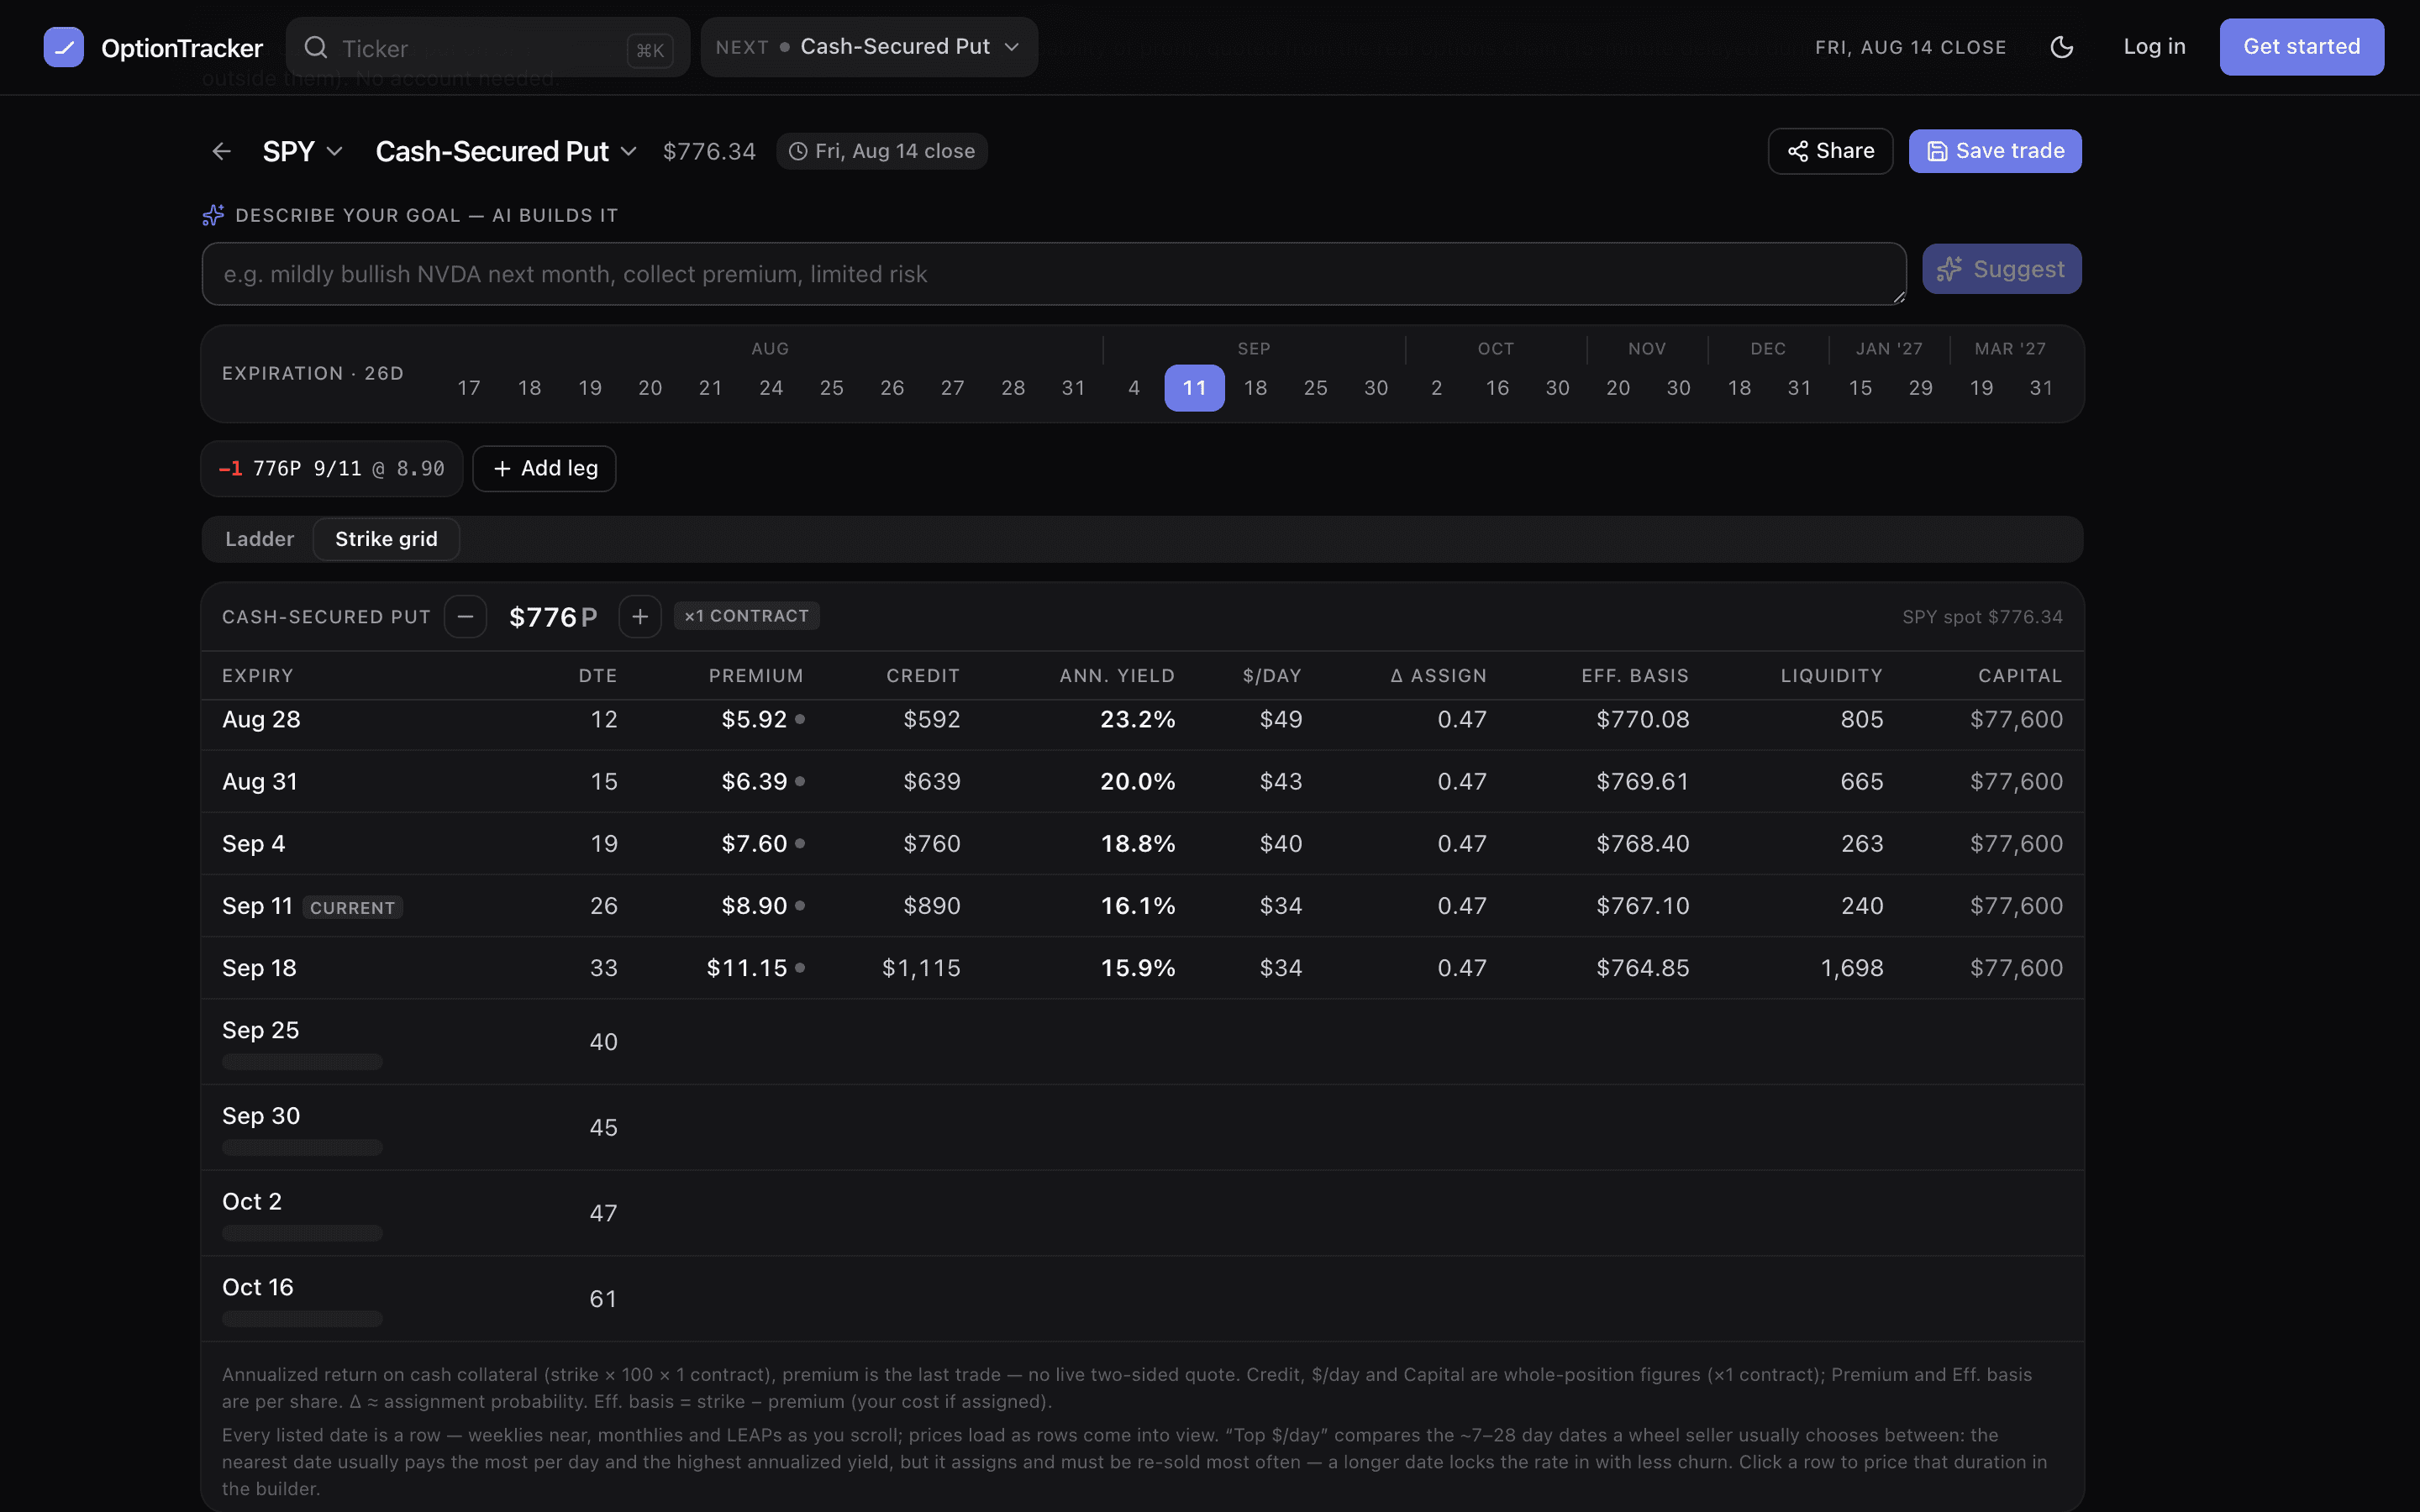
A premium seller’s real question is usually not “which strategy” — it is “I would defend the 85 strike; which expiry pays me best for it?” The strike-first table answers exactly that: one strike, priced across every expiry the chain lists, side by side.
Where it lives
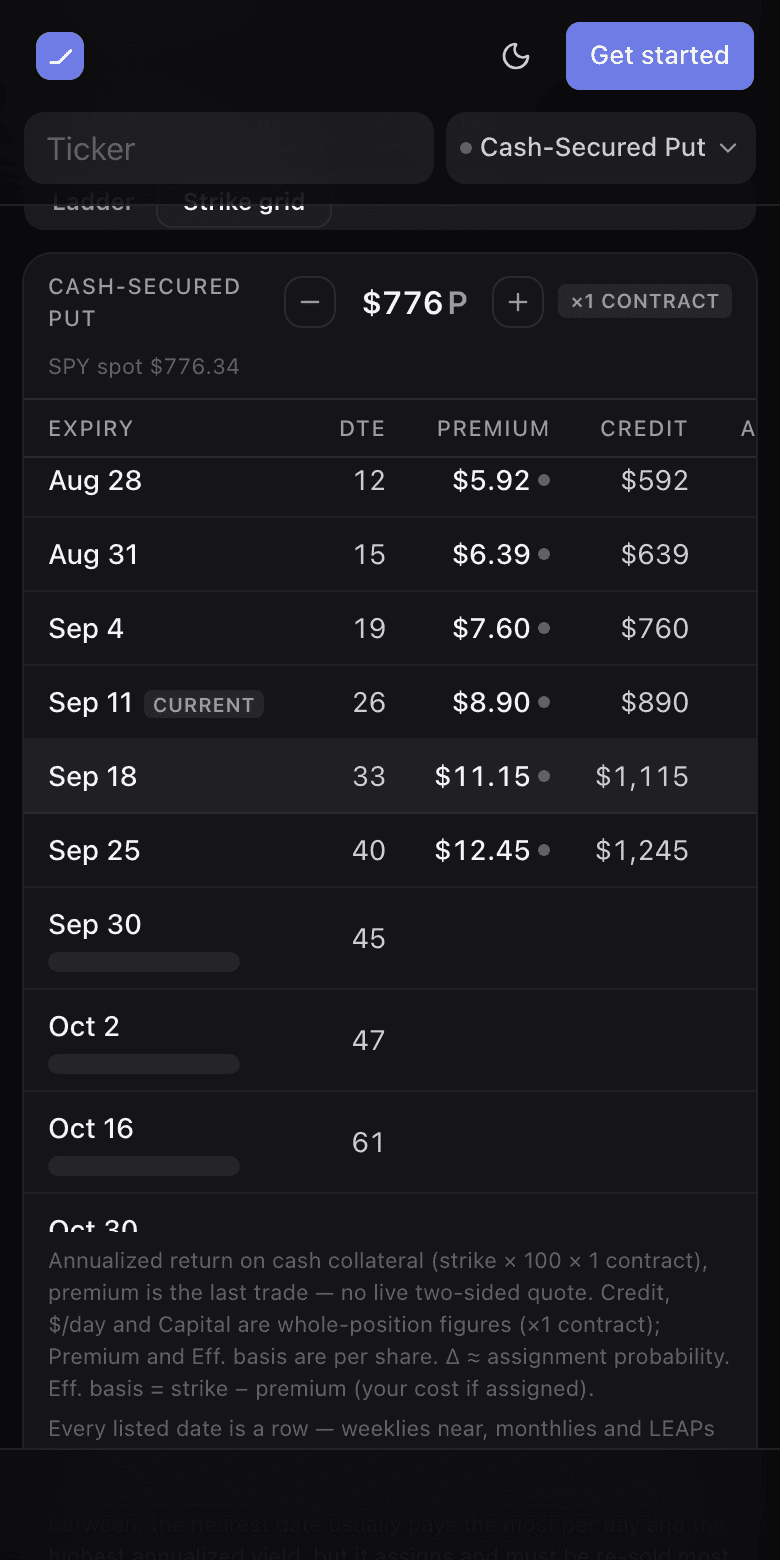
Build a cash-secured put or covered call and a Ladder / Grid toggle appears above the ladder. Ladder is the classic view — one expiry, every strike. Grid flips the axis: your strike, every duration. Swap strategies out of the wheel family and the builder falls back to the ladder; swap back and your view choice is remembered.
How deep it goes
Every date the chain lists is a row — weeklies up close, monthlies further out, LEAPs at the bottom — so selling three months out is a scroll, not a limitation. Rows show their date and days-to-expiry immediately and price themselves as they come into view; the grid opens centred on your current expiry.
Reading the columns
| Column | What it tells you |
|---|---|
| Premium | The per-share credit at that expiry, from its chain. |
| Credit | The total you collect: premium × 100 × your contract count. |
| Ann. yield | The premium as a yearly rate on the collateral — comparable across durations, and unchanged by how many contracts you sell. |
| $/day | Position premium divided by days to expiry — the income-per-calendar-day lens, for all your contracts. |
| Δ assign | Roughly the chance the option finishes in the money. |
| Breakeven | Kind-aware and per share: a CSP shows the effective basis if assigned; a covered call shows the if-called sale price. |
| Liquidity | Open interest and the bid/ask spread width. Thin markets get flagged. |
| Capital | What the whole position ties up, gross — strike (CSP) or spot (CC) × 100 × contracts. The summary bar’s Est. margin is this same capital with the credit you collect netted off it. |