Dashboard Overview
Your options trading command center. View portfolio value, daily P&L, open positions, upcoming expirations, and quick actions all in one place.
The Dashboard is your command center for tracking options trading performance. Here's everything you need to know about the metrics and features available.
Dashboard Layout
Your dashboard is organized into several key sections designed to give you a complete picture of your trading activity.
Portfolio Overview
The top row displays three key portfolio cards:
Portfolio Value
Shows the total value of your open stock positions:
- Total Value - Current market value of all stock holdings
- Cost Basis - What you originally paid for the positions
- Unrealized P&L - Paper gain/loss with percentage return
Premium Collected
Tracks total premium collected from selling options:
- Total Premium - Sum of all premium received from SELL trades
- From Puts - Premium from cash-secured puts
- From Calls - Premium from covered calls
This helps you track your income from the wheel strategy.
Watchlist Preview
Quick glance at your watched tickers:
- Shows top 5 tickers from your watchlist
- Real-time prices with daily change percentage
- Click "View All" to see your full watchlist
Key Metrics
Total Realized P&L
This shows your actual profit or loss from trades that have been closed. It includes:
- Closed option trades (expired, closed, or assigned)
- Sold stock positions
- All associated fees and commissions
A green value means you're profitable, red indicates a loss.
Total Unrealized P&L
This represents the current value of your open positions compared to what you paid. It fluctuates as market prices change and includes:
- Open option contracts (at current market value vs. your entry price)
- Open stock positions (current value vs. cost basis)
Note: Unrealized P&L is theoretical until you close the position.
Open Positions
A quick count of how many active positions you're managing:
- Open option trades
- Open stock positions
- Active covered calls
Win Rate
Your success rate calculated as: Winning Trades / Total Closed Trades
A winning trade is any closed position with a positive realized P&L.
Cash Committed (CSPs)
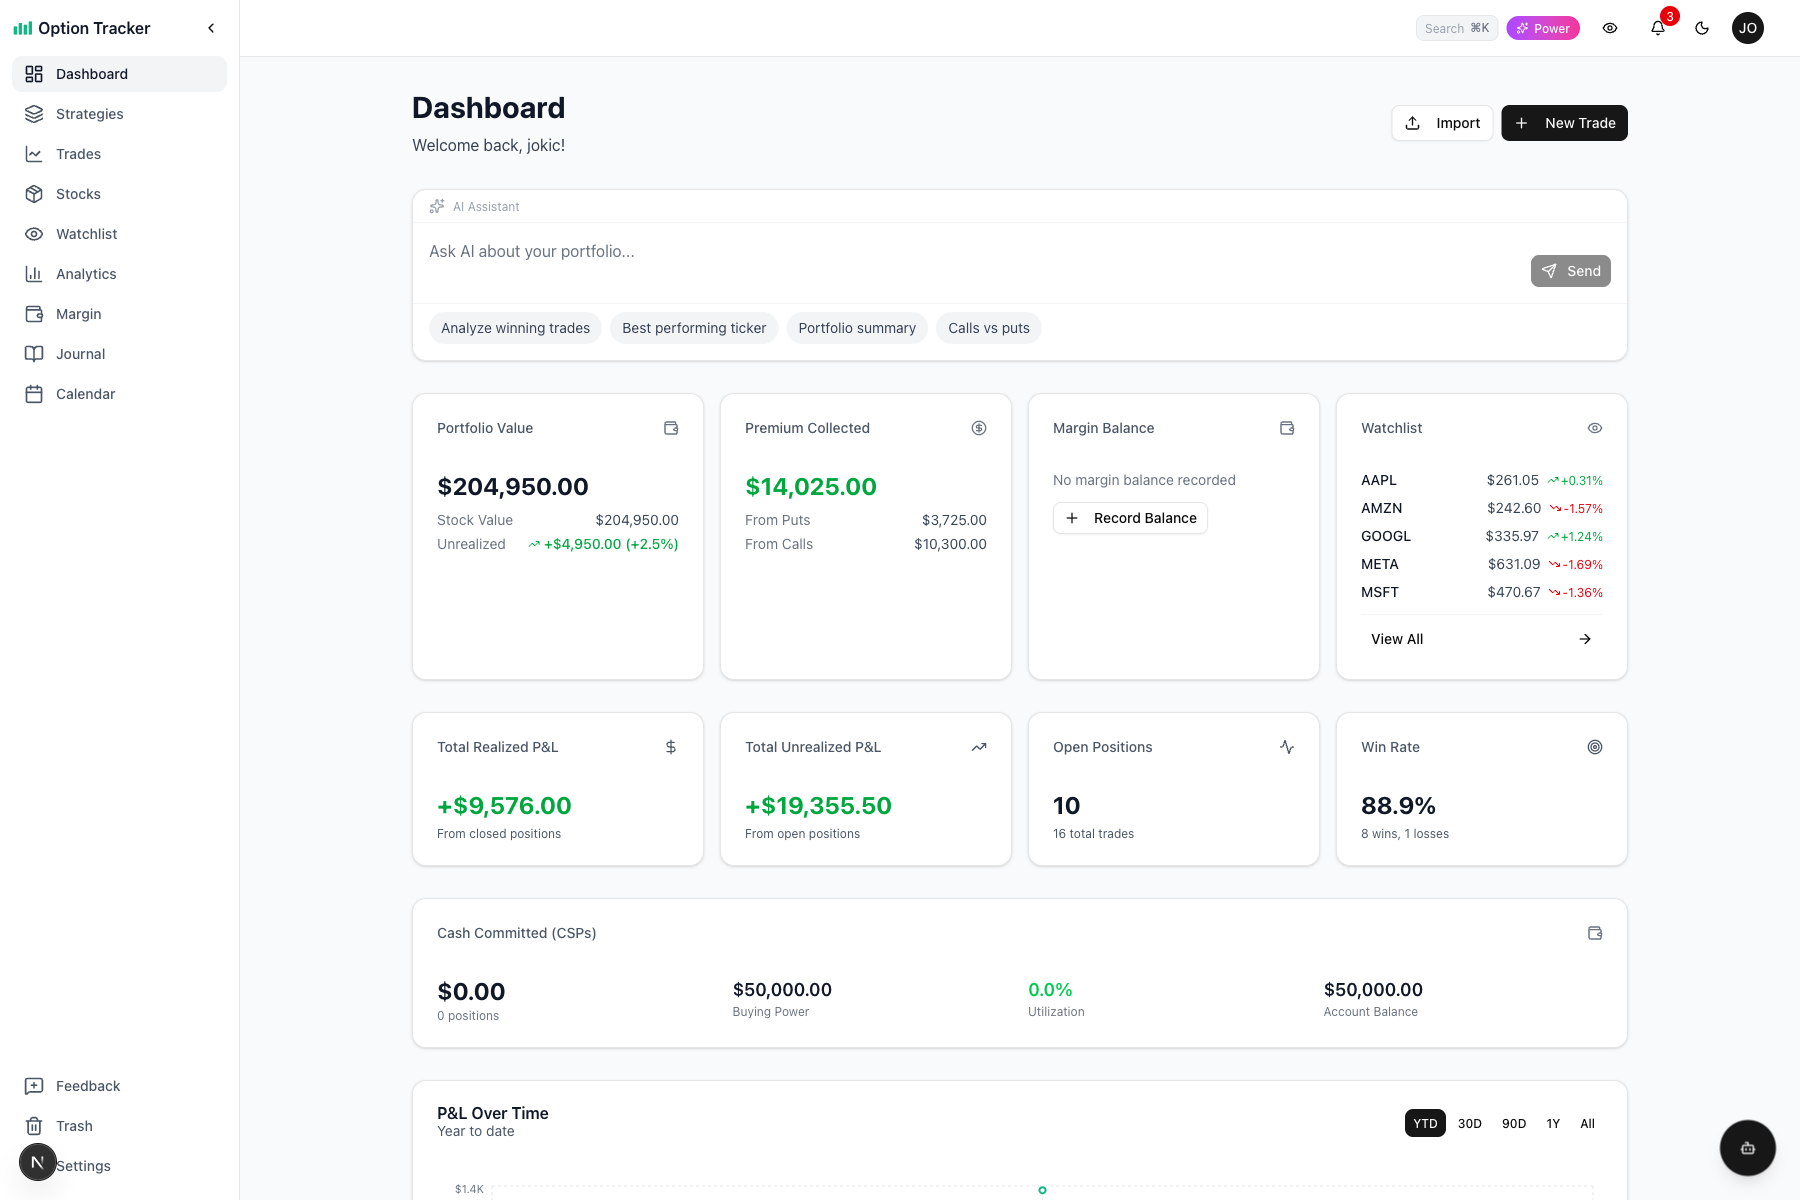
This card tracks the total cash committed to your cash-secured put (CSP) positions. When you sell a put, you need to have cash available to purchase the shares if assigned. This card helps you monitor that capital commitment.
Metrics Displayed
- Total Committed - Sum of (strike price × contracts × 100) for all open CSPs
- Positions - Number of open CSP positions
- Buying Power - Remaining cash after CSP commitments (Account Balance - Total Committed)
- Utilization - Percentage of account balance committed to CSPs
- Account Balance - Your total account balance (set in Settings → Profile)
Utilization Colors
The utilization percentage is color-coded to help you manage risk:
- Green (< 50%) - Conservative position sizing
- Yellow (50-80%) - Moderate capital deployment
- Red (> 80%) - High capital utilization, limited flexibility
Ticker Breakdown
Click "Show breakdown by ticker" to see how your CSP capital is distributed across different tickers, including the amount committed and percentage of total for each.
Setting Account Balance
To see buying power and utilization metrics, set your account balance in Settings → Profile → Account Balance. This is optional but recommended for tracking your capital deployment.
Note: The Cash Committed value also appears on individual trade cards for CSP positions as "Cash Req:" in the metrics row.
P&L Chart
The chart visualizes your cumulative profit/loss over time. Use the date range buttons to filter:
- YTD - Year to date (default)
- 30D - Last 30 days
- 90D - Last 90 days
- 1Y - Last 12 months
- All - All time
Reading the chart:
- Upward slope = profitable period
- Downward slope = losing period
- Steeper lines = larger gains/losses
- Y-axis uses compact format ($1.5K, $3.0K) for readability
Recent Positions
This section shows your most recent open positions with key details:
- Ticker & Type - The stock symbol and whether it's a call, put, or stock position
- Status - OPEN, CLOSED, EXPIRED, or ASSIGNED
- Strike & Expiration - For options, the strike price and expiry date
- Premium/Cost - What you paid or received
- Current Value - Real-time market value
- Unrealized P&L - Your current paper gain/loss
Click "View All" to see your complete position list.
Recent History
Shows your recently closed or expired positions with their final P&L. This helps you track:
- Which strategies are working
- Patterns in your trading
- Recent wins and losses
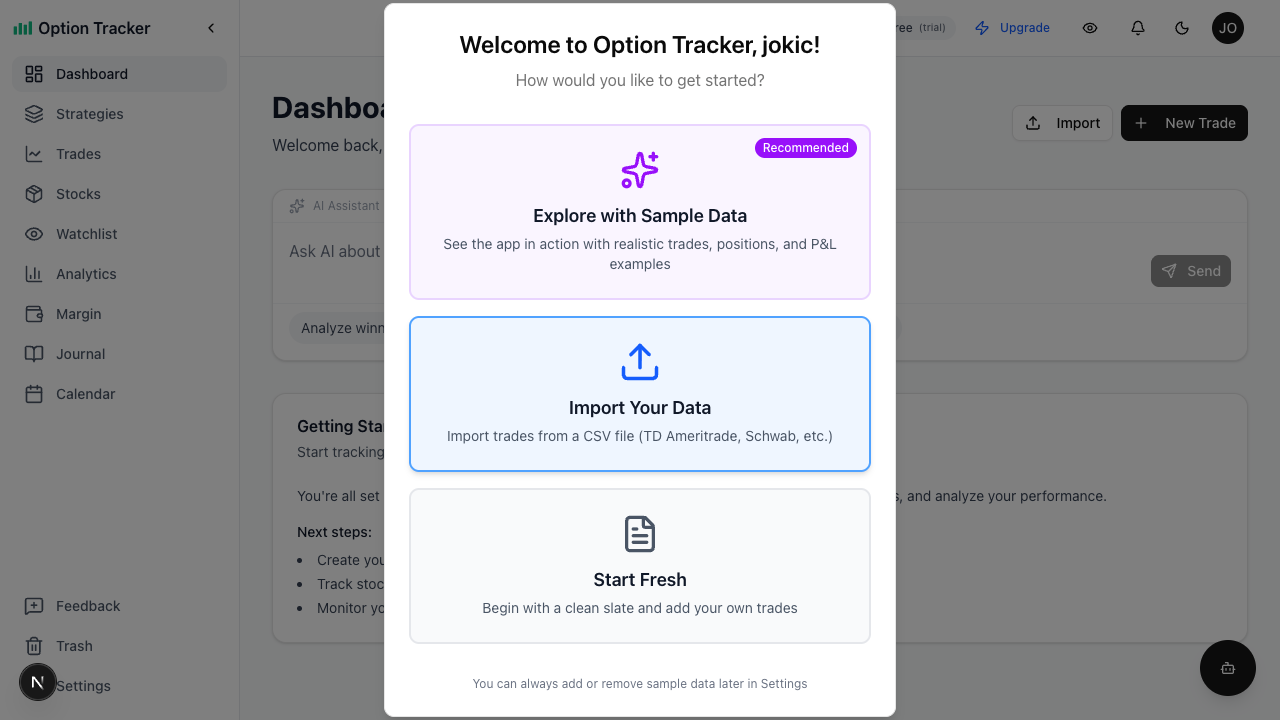
AI Assistant
The embedded AI assistant can answer questions about your portfolio:
- "What's my best performing ticker?"
- "Analyze my winning trades"
- "Give me a portfolio summary"
Type your question or use the suggested prompts to get instant insights.
Quick Actions
New Trade Button
Click "+ New Trade" in the top right to log a new option trade. This opens the trade entry form where you can record:
- Ticker symbol
- Option type (Call/Put)
- Action (Buy/Sell)
- Strike price and expiration
- Premium and fees
Navigation
Use the sidebar to access other sections:
- Trades - Full list of all option trades
- Stocks - Your stock positions from assignments
- Watchlist - Track tickers you're interested in
- Analytics - Detailed performance analysis
- Margin - Track margin usage and buying power
- Journal - Trading notes and reflections
- Calendar - View expirations and earnings dates
- Settings - Account and app preferences
The sidebar can be collapsed to icon-only mode for more screen space. See Navigation for details.
Tips for Using the Dashboard
- Check daily - Review your unrealized P&L to monitor open positions
- Track trends - Use the P&L chart date ranges to spot winning/losing streaks
- Monitor premium - Use the Premium Collected card to track your income strategy
- Watch your watchlist - Quick price checks without leaving the dashboard
- Ask the AI - Use the assistant for quick insights without manual analysis