Analytics
Analyze your options trading performance with win rates, P&L charts, strategy breakdowns, and portfolio metrics. Track trends and identify areas for improvement.
The Analytics page provides comprehensive insights into your trading performance, helping you identify strengths, weaknesses, and opportunities for improvement.
Analytics Overview
Navigate to Analytics from the main navigation to access your performance dashboard.
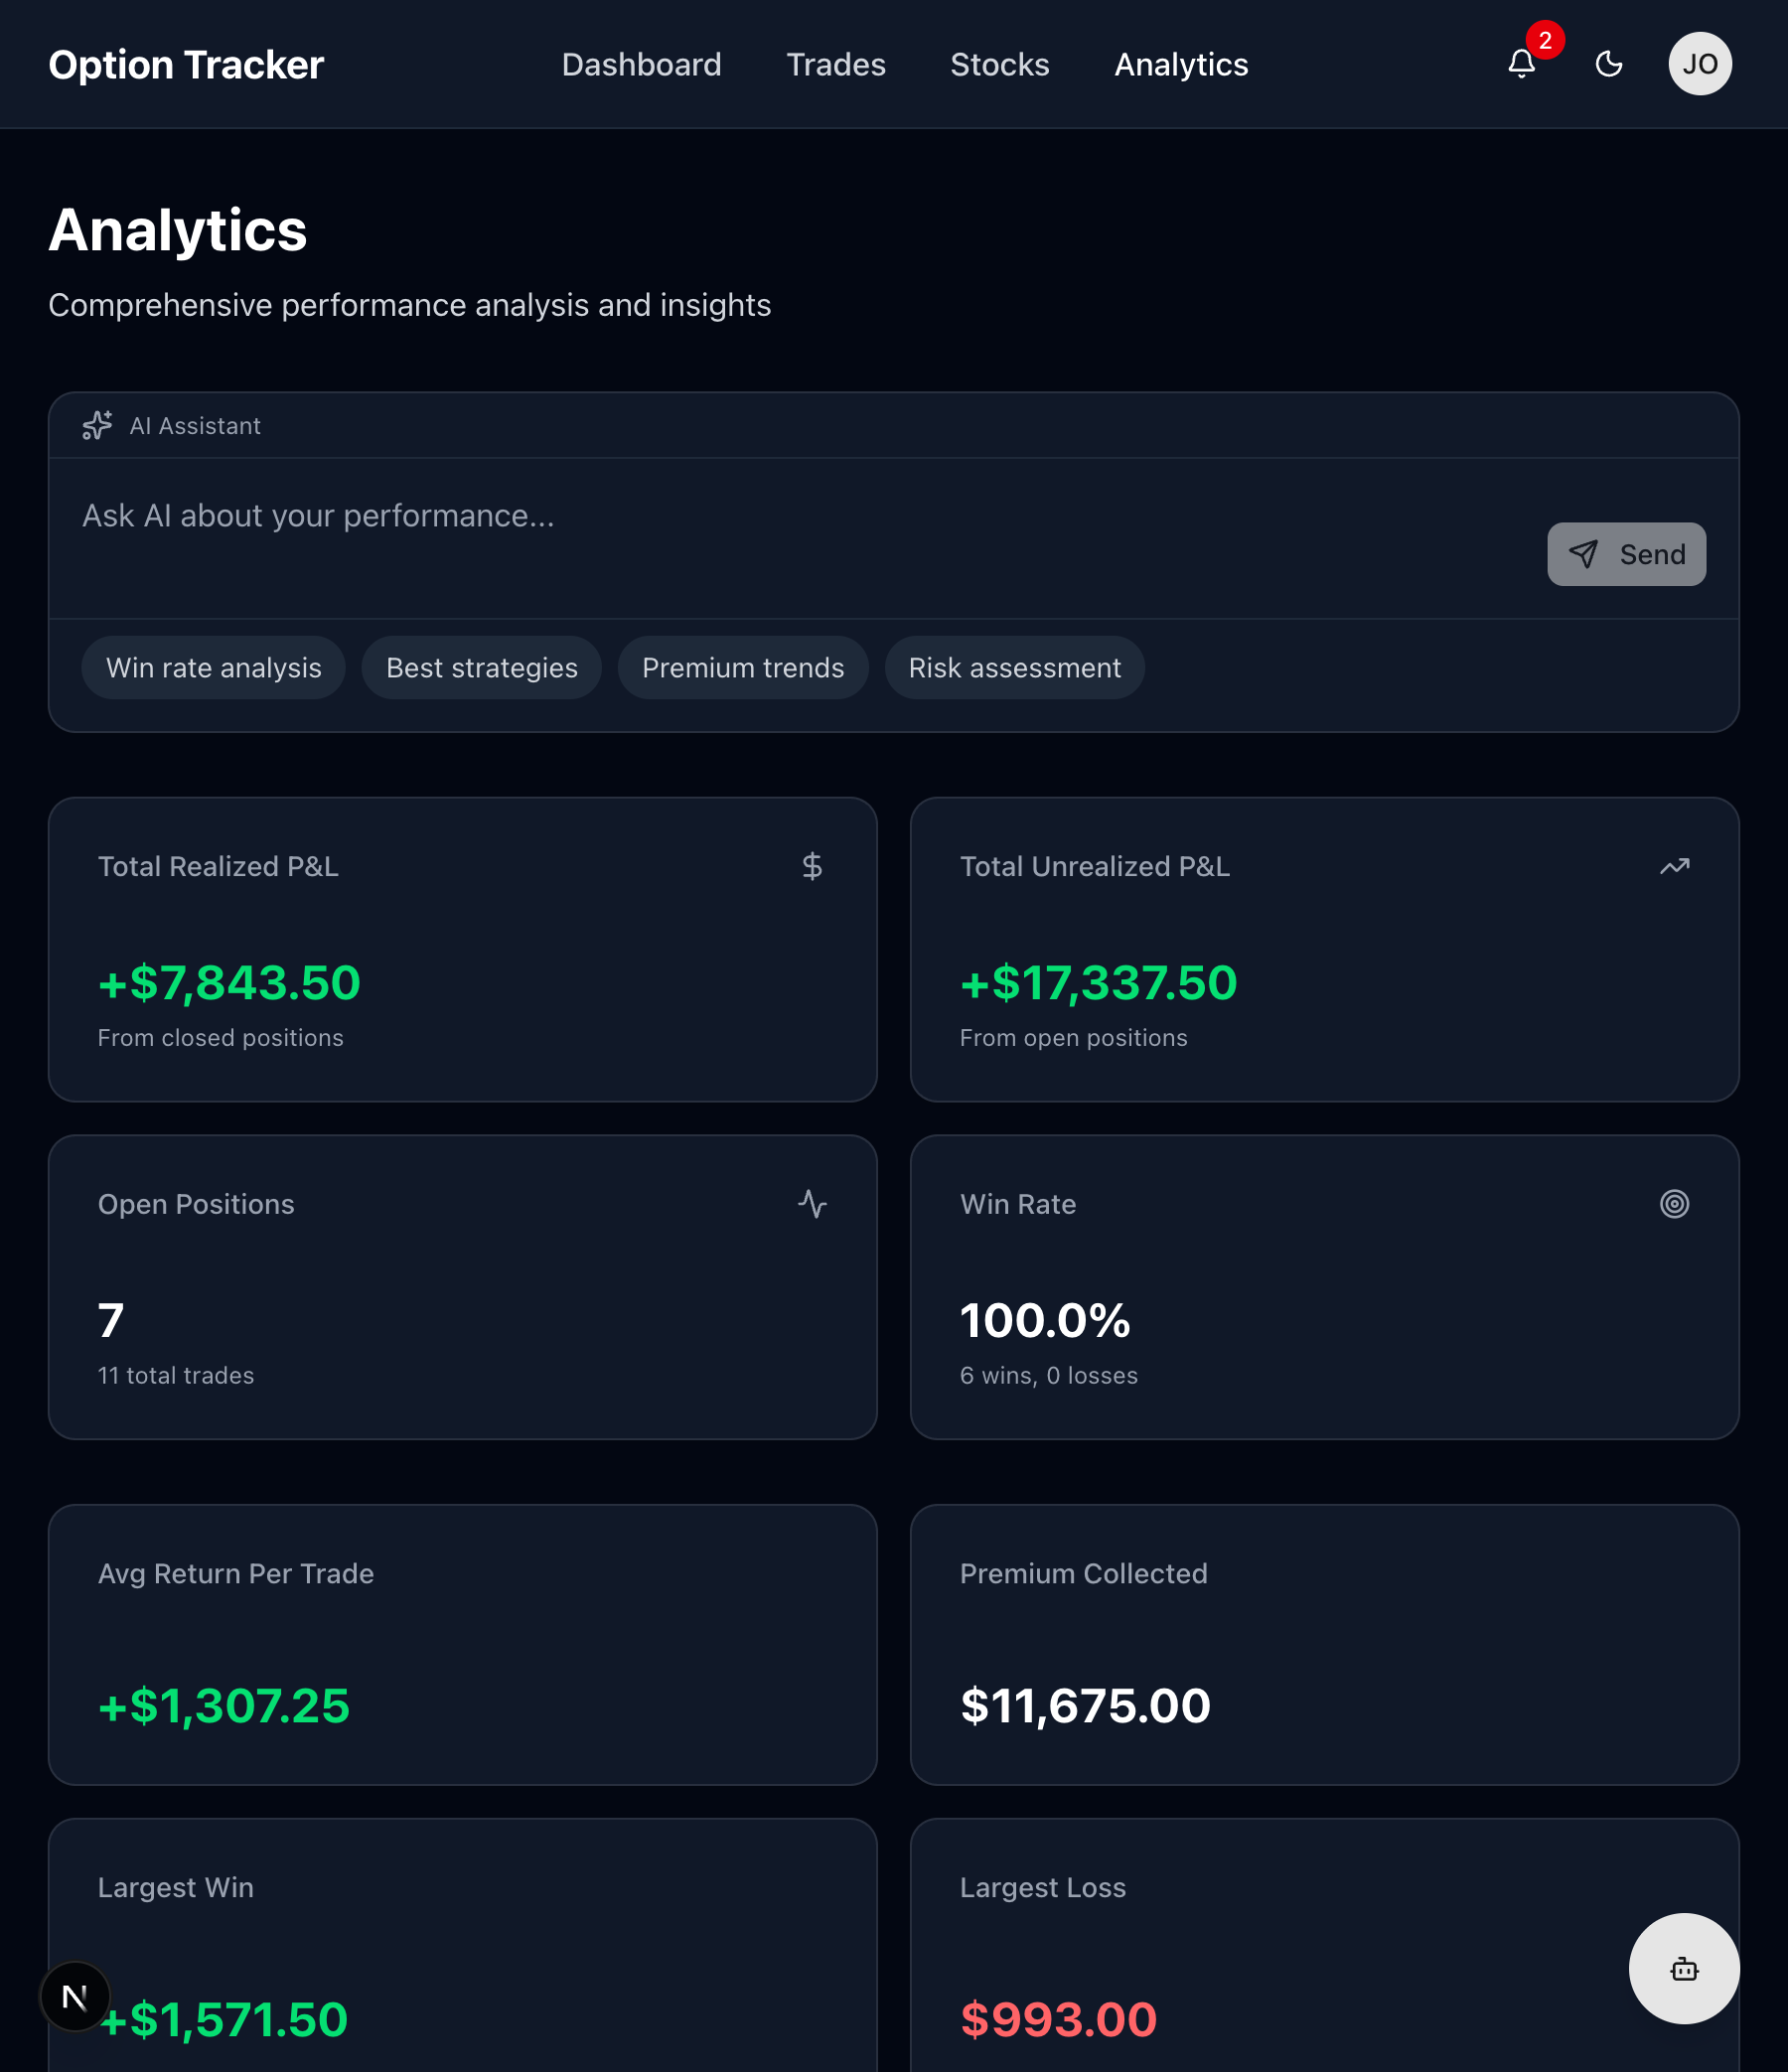
Key Performance Metrics
Win Rate
Your success rate across all closed trades:
Win Rate = (Profitable Trades / Total Closed Trades) × 100
Interpreting Win Rate:
- 60%+ - Strong performance
- 50-60% - Average, look for improvements
- Below 50% - Review your strategy
Average Return
Mean profit/loss per trade:
Average Return = Total Realized P&L / Number of Closed Trades
This helps you understand your typical trade outcome.
Best & Worst Trades
Quickly identify:
- Your most profitable trade
- Your largest loss
- Learn from both extremes
Total Premium Collected
For option sellers, this shows total premium received across all sold options (puts and calls).
Total Fees Paid
Track your trading costs:
- Broker commissions
- Per-contract fees
- Helps evaluate if fees are eating into profits
Performance Charts
P&L Over Time
A line chart showing your cumulative realized P&L over time:
- Upward trend - Consistent profitability
- Plateaus - Periods of consolidation
- Dips - Losing streaks to analyze
Use this to identify:
- Seasonal patterns
- Impact of market conditions
- Strategy effectiveness over time
Monthly Returns
Bar chart showing profit/loss by month:
- Green bars = profitable months
- Red bars = losing months
- Compare month-over-month performance
Trade Distribution
Pie charts showing breakdown by:
- Option Type - Calls vs. Puts
- Action - Buys vs. Sells
- Status - Open, Closed, Expired, Assigned
Understand your trading style and diversification.
Trade Analysis
By Ticker
See which stocks are most profitable:
| Ticker | Trades | Win Rate | Total P&L | |--------|--------|----------|-----------| | AAPL | 15 | 73% | +$2,450 | | MSFT | 12 | 58% | +$890 | | TSLA | 8 | 50% | -$320 |
Focus on tickers where you perform best.
By Strategy
Compare performance across strategies:
- Selling Puts - CSP strategy results
- Selling Calls - Covered call income
- Buying Options - Directional trades
By Expiration Length
Analyze results by days to expiration:
- Weekly (0-7 DTE) - Short-term trades
- Monthly (21-45 DTE) - Standard options
- LEAPS (180+ DTE) - Long-term positions
Find your optimal timeframe.
Using the AI Assistant
The Analytics page includes AI-powered analysis:
Suggested Queries
- "What's working best?" - Identify successful patterns
- "Where am I losing money?" - Find areas to improve
- "Compare calls vs puts" - Strategy comparison
- "Monthly performance review" - Detailed breakdown
Custom Analysis
Ask specific questions like:
- "What's my win rate on AAPL puts?"
- "How much premium have I collected this quarter?"
- "What's my average holding period for winners?"
Filtering Analytics
Narrow your analysis using filters:
Date Range
- Last 7 days
- Last 30 days
- Last 90 days
- Year to date
- All time
- Custom range
By Status
Focus on:
- All trades
- Only closed positions
- Only assigned trades
By Type
- All options
- Calls only
- Puts only
- Stock positions
Exporting Data
Export your trading data for external analysis:
- Click "Export" button
- Choose format (CSV or PDF)
- Select date range
- Download your data
Use exports for:
- Tax reporting
- Spreadsheet analysis
- Backup records
Interpreting Your Analytics
Signs of a Good Strategy
- Win rate above 50%
- Positive average return
- Consistent monthly profits
- Low maximum drawdown
Warning Signs
- Declining win rate over time
- Large losses outweighing small wins
- Overconcentration in few tickers
- High fee ratio to profits
Questions to Ask
- Which strategies are profitable? Compare selling vs. buying options
- Am I diversified? Check ticker distribution
- What's my edge? Find patterns in winners
- Where do I struggle? Identify losing patterns
Improving Your Performance
Based on analytics, consider:
If Win Rate is Low
- Tighten entry criteria
- Use longer expirations
- Stick to high-probability setups
If Average Loss > Average Win
- Use stop losses
- Size positions appropriately
- Cut losers faster
If Fees Are High
- Trade less frequently
- Use larger position sizes
- Consider broker alternatives
Tracking Progress
Review analytics regularly:
- Daily - Quick P&L check
- Weekly - Review open positions
- Monthly - Full performance review
- Quarterly - Strategy adjustments